Showy white paper

From project to sales cycle.

Six steps to make the most of your customer references.

32 pages · 30 min read · Updated May 22, 2026

This white paper grew out of an observation shared by most professional services firms: customer references are one of the most consulted assets in the sales cycle, and one of the least well tooled internally. Everyone knows they should be dealt with. Very few organizations actually get to it, because the subject seems both obvious and unfeasible.

It's written for the people who own this subject in a software and computing services company, a consulting firm, or an agency — marketing leadership, sales leadership, presales, executives — and who want to move from managing shared folders to a real practice.

The method has six steps, presented in the order you encounter them in practice. Each step is applicable independently. The white paper reads in 30 minutes; rolling it out usually takes between three and six months.

Introduction diagram: from a delivered project to activatable sales deliverables.
Chapter 01
2×2 matrix of customer-reference use cases — axes recipient (internal/external) and use (sales/marketing). The 'Targeted proposal' quadrant is highlighted.

Chapter 1 — Define your use cases

Before modeling, creating templates, or tooling up, you need to know what your references are for. This step determines everything that follows.

The most common temptation when you start a reference-management project is to begin with the tool. You compare SaaS products, you benchmark features, you start modeling fields. Six months later the tool is in place but no one really uses it — because the library doesn’t serve the right uses.

This chapter proposes the opposite. Start from the uses. Identify the two or three cases that justify the investment, accept not covering everything at first, and let that prioritization guide the choices that follow — modeling, templates, tooling.

A reference serves two worlds: marketing and sales

First thing to take in: the customer reference isn’t a single object with a single use. It serves at least two different functions in the company — marketing (acquire) and sales (convert). The two have distinct needs, distinct angles, distinct timescales.

Marketing uses the reference to produce top-of-funnel content: downloadable case studies, LinkedIn posts, industry pages, campaign messaging. It looks for narrative depth, storytelling, public social proof. Its time constraint is long: it produces on a schedule.

Sales uses the reference to respond to a prospect: a slide in a proposal, two lines in an email, an argument in a meeting. It looks for targeted relevance — one prospect, one moment, one argument. Its time constraint is short: it produces on demand.

A single tool, a single format, a single process doesn’t cover these two worlds. That’s why cobbled-together libraries end up serving no one: designed for marketing, they’re too heavy for sales; designed for sales, they’re too thin for marketing. The way out isn’t to pick a side — it’s to accept from the start that you’ll equip two usage regimes with a single database.

Four recurring use cases

Beyond the two worlds, four concrete use cases come up systematically in professional services firms. They don’t all carry the same criticality, but each deserves to be named so you can decide what you handle and what you don’t.

1. The targeted proposal. A rep responds to a prospect. They look for two or three relevant references — same industry, same client size, same problem — to insert into their proposal. The need: find them fast, in the right slide format, without starting from scratch. The frequency: several a month for an active rep, several a week across a team.

2. The large-account vendor listing. A buyer at a large group asks for a reference matrix in their imposed Excel format. 50 to 200 lines, structured data specific to the buyer’s layout. The need: fill in a standardized table with precise fields (date, amount, scope, technology, reference contact). The frequency: occasional but high-stakes — a poorly filled matrix eliminates the bid.

3. Marketing content. Marketing produces an in-depth case study, a LinkedIn post, an industry page, campaign messaging. The need: narrative depth, client quote, quantified results, reproducible lessons. The frequency: per the editorial calendar — a few pieces a month.

4. Internal onboarding. A new rep or consultant joins. They have to understand what the firm knows how to do, in which industries, with which kinds of clients. The need: an overview, access to the knowledge, internal points of contact. The frequency: 1 to 10 people a year depending on your growth.

Each of these cases has a different demand on the data. The proposal calls for tactical precision. The vendor listing, for standardized structuring. Marketing, for narrative depth. Onboarding, for an overview. Trying to cover all of them with a single reference format drags each toward the lowest common denominator.

The angle changes with the recipient

The best way to grasp this multi-use logic is to take a concrete case and spin it into the four formats.

Take a real project: a product-return journey redesign at a European retail player, an 8-week engagement, a team of 4, average processing time down from 11 minutes to 4 minutes per return. Here’s how that same reality takes shape depending on the recipient:

In a sales proposal, it’s a single slide. Client logo at the top, project title, three key figures large, methodology summed up in two lines, duration and team size as metadata. A format optimized for the eye of a buyer scanning 20 slides in 10 minutes. What it needs: visual impact and industry relevance. What has no place: the exhaustive list of technologies, the strategic context, the lessons.

In a large-account vendor matrix, it’s a single line in the imposed Excel table. Start date, end date, amount, scope, technologies used, client reference contact. A format optimized for administrative compliance. What it needs: accurate structured fields. What has no place: any narrative.

In a marketing article, it’s a 600-to-1,200-word text. Client context, business challenge, methodological approach, quantified results, a client quote if available, reproducible lessons. A format optimized for long reading. What it needs: narrative, the client’s voice, depth. What has no place: confidential internal figures.

In internal onboarding, it’s an entry in an internal knowledge base, with a link to the project report, access to anonymized technical deliverables, the internal contacts who carried the project. A format optimized for learning. What it needs: transparency on the real trade-offs, the difficulties encountered, what you’d do differently.

It’s the same project, spun into four radically different objects. Without this explicit multi-format logic from the start, you fall into one of two traps: either you enter the same information four times (a massive waste on the production side), or you enter it once and three of the four uses are poorly served (a loss of value on the usage side).

How to choose your two or three priority use cases

The classic mistake is wanting to cover all four cases in the very first project. That’s a guarantee of doing none of them well. Three questions are enough to decide.

Which case wastes the most time today? Ask five reps and your marketing lead. The answer usually converges on one or two cases. In the software and computing services companies and consulting firms we see, the targeted proposal and the large-account vendor listing almost always come out on top.

Which case has the most impact on your conversion? A proposal that goes out half a day earlier with a relevant reference wins on the first-impression effect. A poorly filled large-account vendor listing, on the other hand, closes the door before the meeting even happens. The question to ask: where do you concretely lose deals for lack of a reference available at the right moment?

Which case raises the fewest sensitive-data issues? Marketing content almost always requires the reference client’s formal consent. The internal proposal often works without that consent, depending on what the original contract allows. Starting with the legally least friction-prone cases lets you fill the library without getting bogged down in approvals.

In practice, the most common starting combination is proposal + large-account vendor listing. Marketing content comes in a second wave, once the library is denser and client quotes have been collected. Internal onboarding is often a side effect — if the first two cases are well equipped, onboarding works almost for free.


Key takeaways

  • A reference serves at least two worlds (marketing and sales) with different demands — accept that dual regime from the start
  • Four recurring use cases: the targeted proposal, the large-account vendor listing, marketing content, internal onboarding
  • The same project spins into four radically different formats — that’s what your library must enable
  • Start with two cases rather than aiming for all four: the most common combo is proposal + large-account vendor listing

Once your priority use cases are identified, you know what your references must contain to serve those uses. The next chapter explains how to structure that information — which fields are mandatory, which are optional, and how to avoid the “catch-all” model that discourages data entry.

Key takeaways
  • A reference serves two worlds: marketing and sales.
  • The 4 recurring use cases.
  • How to choose your 2 or 3 priority use cases.
Chapter 02
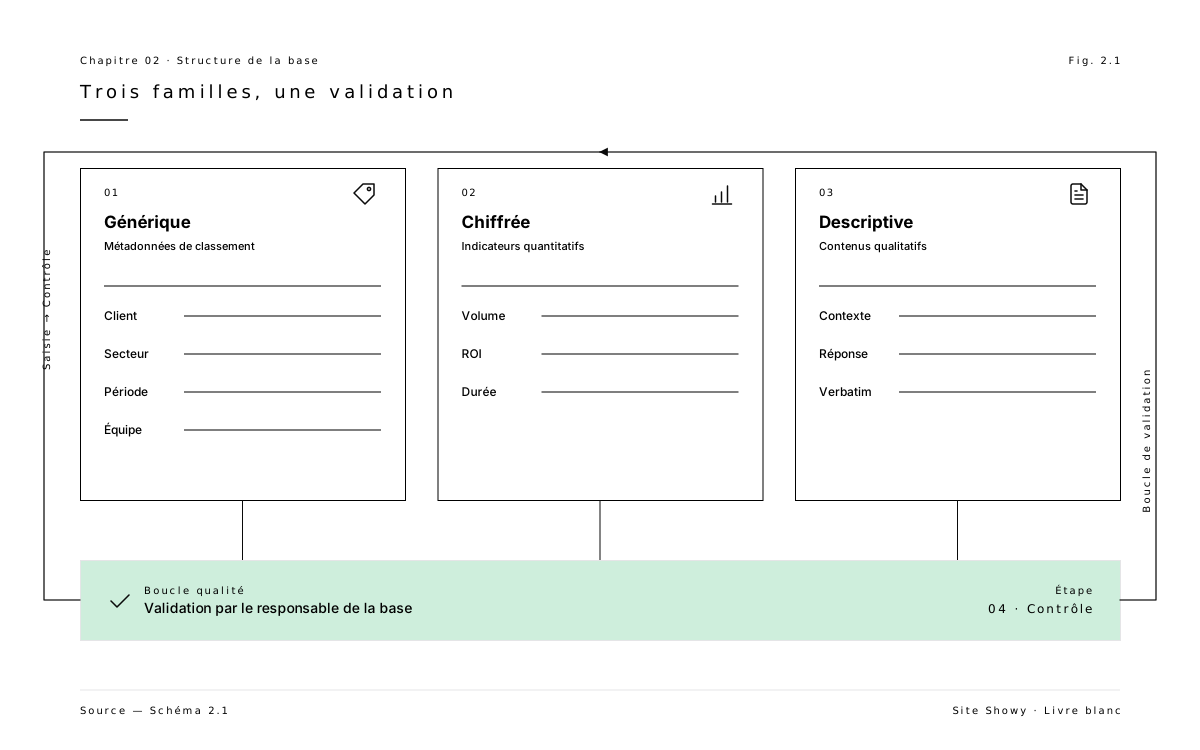
Three field families (generic, quantified, descriptive) connected by an approval band from the library owner at the bottom of the diagram.

Chapter 2 — Model your references

What is a reference at your firm? This modeling exercise is short, but it’s what makes search, automatic generation, and steering possible.

To model is to define the data before tooling it. It’s the step everyone tends to skip, because it produces nothing visible. And it’s also the one whose absence is paid for the longest. Without a clear model, you buy a tool with fields that seem right today, that match no use tomorrow, and that no one fills in the day after.

The right reflex: lay out the model first, on paper or in a spreadsheet, before any technology choice. A half-day workshop with a few people from marketing and sales is enough in most cases. This chapter describes the method and provides a starting point — twelve fields that cover most uses.

Three field families

A reference breaks down into three families of information. Distinguishing these families from the start avoids catch-all models where everything is treated with the same level of importance.

Generic fields identify the project and its context. Client name, industry, company size, engagement type, period, team. These are structured data, short, with limited choices (drop-downs most of the time). They’re used to filter, search, classify. Without these fields, your library isn’t queryable — it’s a graveyard of PDFs that all look alike.

Quantified fields capture what can be measured. Volume processed, productivity gain, KPI improvement rate, program size. These are the data that make the case in a proposal and a case study. Without them, you tell a story with no demonstration. Caution: not every quantified field is shareable — your internal costs are quantified but never go outside.

Descriptive fields carry the narrative. Client context, the challenge to solve, the method applied, the lessons. These are text fields of defined length (300 words for context, 500 words for the response, for example). They feed long content: case studies, articles, detailed vendor-listing presentations. Without a length constraint, they drift — either cut to the extreme or endless.

These three families have their own entry regime. Generic fields are filled at signature. Quantified ones are collected at delivery or after. Descriptive ones require dedicated writing work, which falls outside the project lead’s agenda. That’s why mixing all three in a single form dooms completion.

Internal vs shareable fields: the critical distinction

On each of the three field types, an additional distinction must be set from the model: what stays internal, what’s shareable in a confidential proposal, what’s public. This distinction isn’t added later — it’s modeled from the start, because it conditions everything else: access rights, document generators, the collection of client consents.

Three levels are enough in most cases.

Internal only. The exact project amount, the margin made, the difficulties experienced on the team side, the real technical trade-offs. This data stays in the library, accessible to the reference owners and the executive committee. It never goes out.

Shareable in a proposal. The client name, the order of magnitude of the program, the general methodology, the figures allowed internally but under a client framework agreement. This data goes out in confidential proposals, subject to a non-disclosure clause.

Public. What the client has explicitly agreed to see published — an online case study, a LinkedIn post, an industry page, a homepage. Almost always requires a dedicated written consent.

Labeling each field with one of these three levels at modeling time avoids weeks of legal discussion at production time. You don’t ask “can we publish this?” for every deliverable — you know it by reading the record.

The twelve fields found in every good model

The classic trap is to launch into a model with thirty or forty fields “just in case.” All the field feedback converges on the opposite. The shorter the model, the more it’s filled. The more it’s filled, the more the library serves.

Here are the twelve fields that cover most uses in a professional services firm. The detail varies by trade, but the structure holds 80% of the time:

  1. Client name (with an anonymized variant for confidential distribution: “a European retail player,” “a French mutual bank,” etc.)
  2. Industry (closed list: banking/insurance, retail, industry, public sector, etc.)
  3. Client size (by revenue or headcount band)
  4. Engagement type (advisory, delivery, time-and-materials, fixed-price, license supply)
  5. Period (start date, end date)
  6. Team (size in people, profiles represented)
  7. Client context and challenge (short text, 300 words max)
  8. Response delivered (structured text, 500 words max)
  9. Technologies and methodologies used (list of tags)
  10. Quantified results (three to five measurable before/after KPIs)
  11. Client quote (short quote, attributed or anonymous)
  12. Distribution status (internal only / confidential proposal / public, plus the client-side reference contact)

These twelve fields feed the four use cases from the previous chapter. The targeted proposal relies mainly on 1, 2, 4, 6, 9, and 10. The large-account vendor listing requires 1, 4, 5, 6, 9, 10. Marketing content draws on 7, 8, 10, 11. Internal onboarding skims all fields without favoring any.

Mandatory vs optional: the 80/20 rule

Of these twelve fields, half should be mandatory — without them, the record can’t be considered “publishable.” The other half is optional — it enriches the record but doesn’t prevent its use.

Mandatory: client name, industry, engagement type, period, team, context and challenge, technologies, distribution status. Eight fields that must be filled for a reference to leave the draft stage.

Optional: client size (often available, but not always), detailed response delivered (can come later), quantified results (often available only six months after delivery), client quote (requires a dedicated collection effort).

This distinction has a very concrete function: it’s what drives the reference’s status in the library. As long as the eight mandatory fields aren’t filled, the record stays a draft. As soon as they are, it switches to “internally publishable.” When the four optional fields are also filled and a public client consent is obtained, it can switch to “externally publishable.”

The status is no longer a label set by hand by the owner — it’s a mechanical consequence of how the record is filled in. This automation removes much of the friction in everyday use.

How to avoid the catch-all model

The instinct of every owner modeling for the first time is to add fields. Each meeting surfaces a new idea — “what if we also captured the client’s NPS,” “what if we added the sponsor’s name,” “and the list of subcontractors involved.” Six months later, the model has forty fields, thirty of which are empty in most records.

The effect is mechanical. The longer the form, the lower the completion rate. And the lower the completion rate, the more users distrust the library — they never know whether a record is up to date, complete, reliable. Distrust sets in, use drops, and the tool is gradually abandoned.

Three rules to resist this temptation:

Start with fewer fields than you think you need. Twelve or thirteen max. Add a field only when a concrete use justifies it — and one formalized by a use case you identified in chapter 1.

Test the model on five real projects before industrializing. Take five projects from the last two years, fill in the twelve fields, observe what’s really missing. Often nothing.

Revise the model every twelve to eighteen months. No more often (users hate models that move), no less (needs evolve). A revision = possibly adding one or two fields, possibly removing a field that’s filled nowhere.

A model that lasts two years without major change is a good model. A model revised every three months serves no one.


Key takeaways

  • Three field families (generic, quantified, descriptive), each with its own entry regime
  • Label each field by distribution level (internal / proposal / public) at modeling time
  • Twelve fields are enough to cover most uses — eight mandatory, four optional
  • The reference’s status follows mechanically from how it’s filled, not from a human decision
  • Start simpler than you think you need — add only when a use justifies it

You have a data model. The next step is to plug it into the formats your reps and your marketing produce day to day — the proposal slide, the vendor matrix, the industry page. That’s what chapter 3 calls “creating your templates.”

Key takeaways
  • Three field families: generic, quantified, descriptive.
  • The 12 fields found in every good model.
  • Mandatory vs optional fields: the 80/20 rule.
Chapter 03
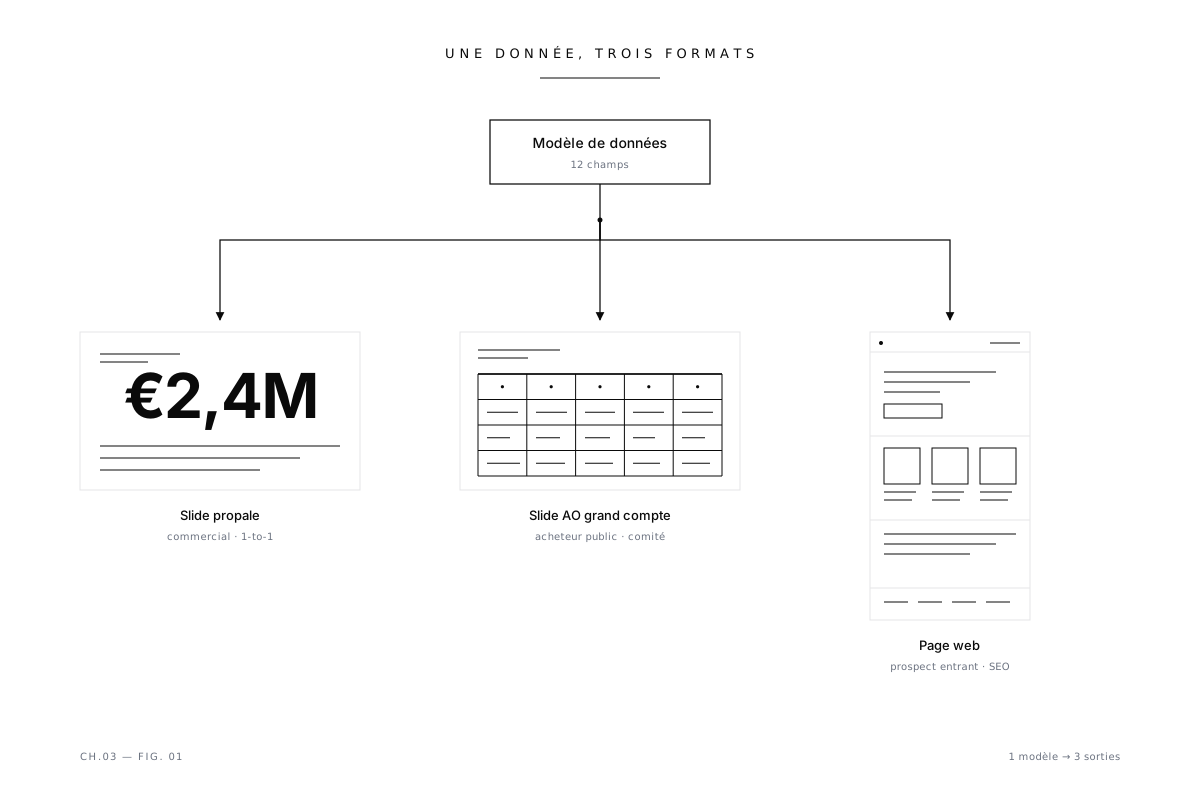
A single data model feeds three templates: proposal slide (highlighted), large-account RFP slide, web page.

Chapter 3 — Create your templates

The template is where your data model meets your sales brand. Three templates are enough to cover most needs.

A template is neither a design nor a Word form. It’s a mechanism: for each field of your data model, where does it appear, at what size, with what hierarchy? Done well, a template turns a complete record into a sales deliverable in under a minute. Done badly, it forces you to recompose every deliverable by hand and reproduces the very problem the tooling was meant to solve.

This chapter describes the three base templates to produce first, the visual-hierarchy rule that separates a useful template from a decorative one, and the method for handling a brand change without redoing everything.

The template is the data model met by the brand

Too many reference templates are designed like brochures. A designer gets the brief “make us a nice reference template,” proposes three layouts, you pick one, you spin it into a few colored versions. The result is pretty, and you fill it in by hand every time.

A good template works the other way. You start from the data model — the twelve fields from the previous chapter — and position each field in the layout. The client name here, at 24 points, at the top. The industry there, small, top right. The three KPIs in the center, very large. The context and the response in two text blocks of set length. Once this plan is laid out, the slide generates mechanically from the data: the filled-in record becomes the slide in one click.

This approach has a concrete consequence: a template must be designed by marketing and sales leadership, not by the design studio alone. The design studio dresses it up — it doesn’t decide the hierarchy. It’s this inversion of responsibility that separates a functional template from a decorative one.

Three base templates, in this order

Most professional services firms need three templates. No more, no less, at the start. These three alone cover 80 to 90% of daily uses.

1. The proposal slide. Landscape 16:9 format, one reference per slide, to insert into a proposal. It has to work alone, with no context before or after. Typical hierarchy: client name at the top, industry and size on the right, context in two lines, intervention in two lines, three KPIs large in the center, metadata (duration, team size, technologies) at the bottom. It’s the most-used template — it goes out several times a week in an active sales team.

2. The large-account RFP slide. Often a more formal format, with specific fields imposed by the buyer (you adapt to the matrix the client provides). It includes fields that don’t appear in a standard proposal: client-side reference contact, framework agreement attachment, GDPR compliance, applicable certifications. It’s an occasional but critical template — when a large account requests a vendor listing, the absence of a template means two days lost reconstructing it.

3. The web page (or vendor-listing page). A long vertical format, used as public marketing content or as a downloadable detailed sheet. It includes the client quote, quantified results in large type, sometimes a narrative. It’s a template that goes out less often — a few times a month — but lives a long time: a good web page is indexed by Google and keeps generating traffic years later.

Once these three templates are produced, you can consider others: an industry template (a “banking-insurance” template featuring regulatory KPIs), an internal-onboarding template, a LinkedIn-post template. But start with the three — they’re enough to test the data model and lock the brand.

The dominant-figure rule

An effective reference slide contains one dominant figure, and only one. Not three, not five. One. Visible in two seconds, remembered in five.

This simple rule is ignored by 80% of the templates we come across. The default reflex is to line up all the KPIs at the same size — reassuring for the author (they include everything) and illegible for the reader (they don’t know where to look). The result is a slide that holds a lot of information and conveys no message.

The rule is mechanical: of the three to five KPIs available in the record, the template must impose a hierarchy. The dominant figure large (at least 56 points on a projected slide), one or two supporting figures at medium size (24 points), the others as small metadata (14 points). The project owner chooses which KPI is dominant when filling in the record — they’re the one who knows what carries weight for the targeted industry.

This hierarchy carries into every variation. On the web page, the dominant figure opens the page. In the vendor matrix, it occupies a highlighted cell. On the LinkedIn post, it’s the hook of the first line. Always the same one, because the source record is the same.

How to handle a brand change without redoing everything

It’s the dread of every firm that has invested in a reference library: you redo the brand, and you have to redo the three hundred references one by one.

That dread has no reason to exist if the templates were properly designed. The principle is simple: the data lives in the library, the template is a styling layer applied at generation time. When the brand changes, you modify the templates, not the records. At the next generation, all references display in the new brand automatically.

This data/template separation is the main promise of reference-management tools over document libraries. On Drive or SharePoint, each reference is a PowerPoint file that contains both the data and the formatting. Changing the brand forces you to redo every file. In a dedicated tool, you change the template once; the three hundred records display in the new brand instantly.

To keep in mind when producing your templates: no data should be hardcoded into the layout. No color applied by hand, no client logo positioned manually, no text typed directly into the slide. Everything must come from variables bound to the model’s fields. It’s more constraining to produce at first, and infinitely more durable.

When to plan an industry template

A recurring question: do you need an “industry” proposal template, a “banking” one, a “public sector” one? The short answer: not at the start.

A single well-designed proposal template covers every industry if the visual hierarchy is right. The client’s industry is a metadata field that displays, not a variable that changes the structure. Wanting one template per industry means multiplying the variants to maintain with no proportional gain for the reader.

The moment an industry template becomes relevant: when an industry has graphic conventions imposed by the buyers themselves. Public-sector buyers, for example, are used to vendor-listing files structured to administrative layouts. Responding in a modern proposal slide is, paradoxically, doing worse. In that specific case, an industry template is justified.

Apart from that case, you save time keeping a universal template. Industries are distinguished in the list of references chosen, not in the layout.


Key takeaways

  • The template is the application of the data model to the sales brand — not a brochure
  • Three base templates: proposal slide, large-account RFP slide, web page
  • The dominant-figure rule: a single KPI featured per slide, two or three in support
  • No data hardcoded into the layout — everything comes from the model, so you can change the brand without redoing the records
  • An industry template only when an administrative layout demands it

The model is laid out, the templates are produced. What’s left is the time dimension: a reference isn’t static, it evolves. The next chapter details the four statuses of a reference and who contributes when.

Key takeaways
  • Three base templates: proposal slide, large-account RFP slide, web page.
  • Visual hierarchy: what must stand out.
  • Handling a brand change without redoing everything.
Chapter 04
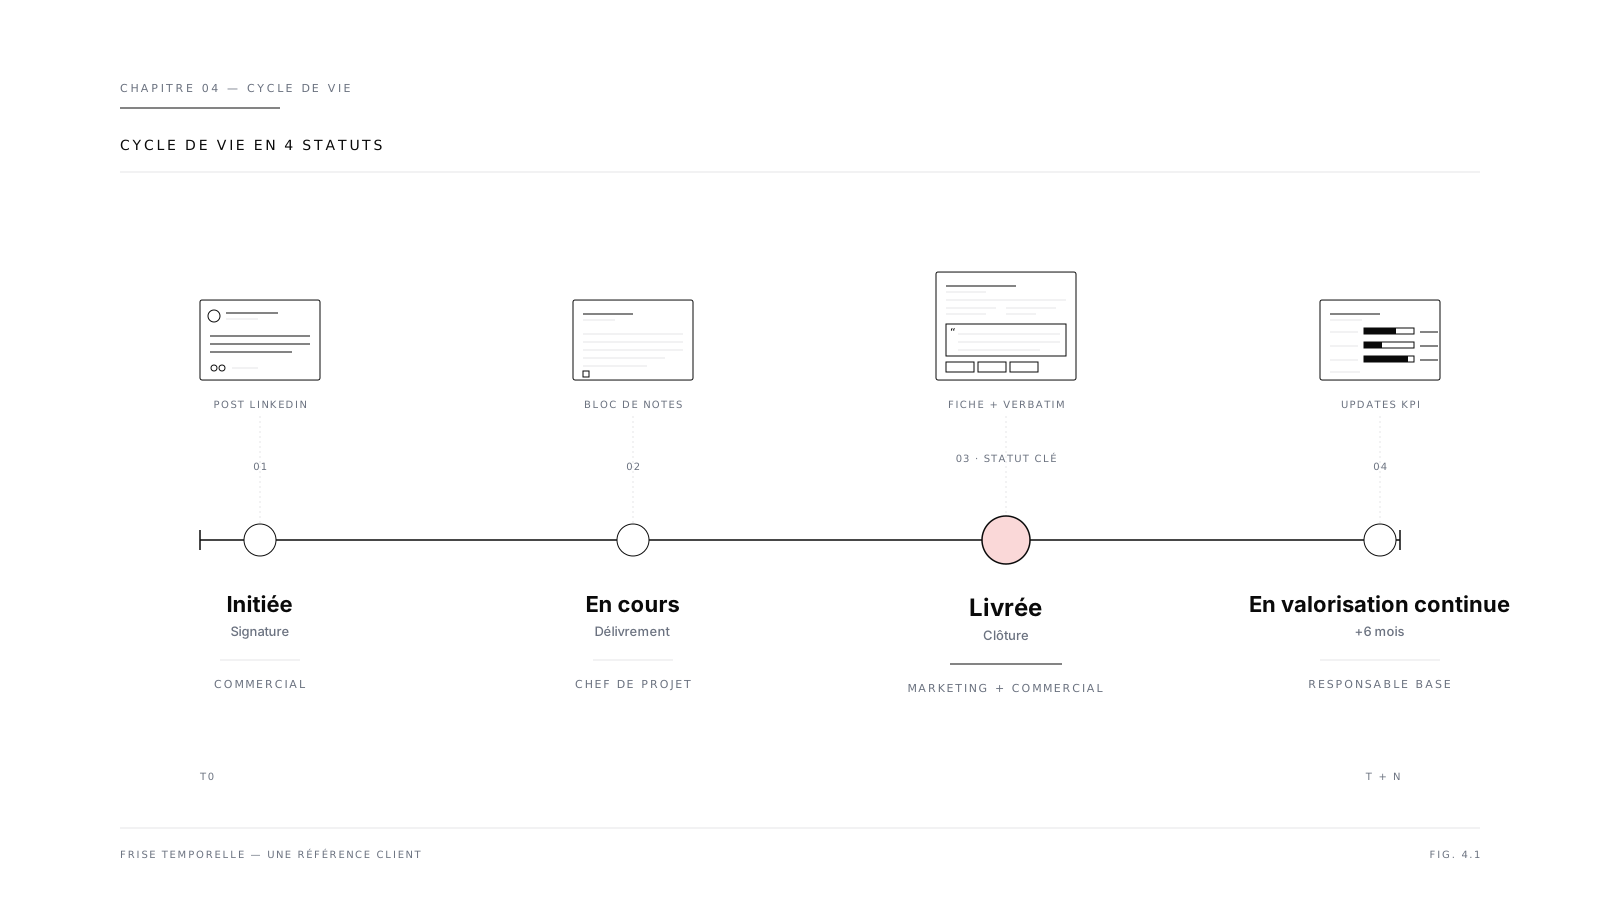
Timeline of the four statuses of a reference: initiated, in progress, delivered (key status highlighted), ongoing value. Contributors and content produced at each stage.

Chapter 4 — Think in lifecycle

A reference isn’t fixed. It has a four-status lifecycle. Thinking about that cycle from the start changes the dynamic of your library.

The most widely shared reflex in professional services firms is to think of a reference as a binary object: it exists or it doesn’t. And it starts to exist the moment the project is delivered, when its record finally gets written.

That reasoning costs you three quarters of the value. A reference lives from the moment the contract is signed, changes nature at each stage, and keeps producing value years after the project ends. The chapter that follows describes these four moments and what you can do with them.

The four statuses of a reference

A reference goes through four successive statuses. Each status corresponds to a different sales function, and therefore different content.

Status 1 — Initiated (at signature). The project is sold but not started. You know who the client is, what the scope is, what the stakes are. At this point, the reference serves to signal the opening of a partnership — internal communication, a LinkedIn welcome post, a newsletter mention, a first record in the library.

Status 2 — In progress. The project is in delivery. You have the first concrete elements: chosen architecture, profiles involved, first deliverables. At this point, the reference serves to flesh out the material for upcoming content and to enrich the sales argument built on the ongoing partnership.

Status 3 — Delivered. The project is finished. You have the final results, the client evaluation, sometimes a quote. This is the status everyone thinks of — and also the one where the record finally gets written in its complete form, with the twelve fields of the model laid out in chapter 2.

Status 4 — Ongoing value. The project has been delivered for several months, even several years. The client kept using what was produced, additional results appeared, renewals happened. The reference isn’t frozen at delivery — it can keep growing as long as the client relationship is alive.

The classic trap is capturing material only at status 3 — so too late, without having documented what was happening before, and without planning for enrichment afterward. Four statuses, four chances to feed the library. Three are systematically wasted.

Each status produces its own content

Each status has natural content. Capturing it at the right moment avoids having to reconstruct everything afterward.

At signature (status 1): an announcement post, an internal kickoff communication, a first minimal record in the library (with the generic fields from chapter 2: client name, industry, size, engagement type, planned period, assigned team). This record switches to “internally publishable” almost immediately — it serves the sales argument as early as the following week (“we’ve just opened a partnership with a European retail player on this topic”).

During the project (status 2): team and working-session photos if they make sense, first diagrams produced, internal checkpoints, weak signals (“the client started raising the subject in their own meetings”). This material feeds future content, and also lets you communicate along the way on LinkedIn — not to tout the project, but to share the expertise that comes out of it (“three pitfalls we avoided on a return-journey redesign”).

At delivery (status 3): the complete record. All mandatory fields filled. Client quote requested. Illustrative visual produced if possible. The reference switches to “internally publishable” automatically (the eight mandatory fields are filled). It can switch to “shareable in a proposal” right after, and later to “public” after obtaining formal client consent.

Several months later (status 4): adding a KPI that held up over time (“six months after rollout, the initial gain held”). Adding a contract renewal (“the client renewed the engagement for three years”). Adding a scope extension (“the pilot was rolled out across all the group’s entities”). These additions give the reference a depth the initial record didn’t have, and make it durably more convincing.

The classic mistake: thinking only at the “delivered” status

Why do cobbled-together libraries almost always capture references at status 3 alone? Because that’s the moment when “there’s something to say” — the project is finished, the results are in, you can finally write the record.

It’s precisely that reasoning that dooms the effort. At status 3, the project lead is already on the next project. They no longer have the context in mind. The raw figures are in the report, but not the story behind them. The client quote requires reopening the sales relationship — which no one took the time to set up during the project.

Writing a reference retroactively takes three to four times longer than capturing it as you go. That’s why reference libraries reconstructed in “catch-up” mode end up as graveyards of incomplete records. No one has the time to reconstruct thirty projects that finished six months ago.

The practical consequence: plan for capture at each status, from the modeling stage. A record at status 1 is legitimate even if it contains only five fields. It’s worth more than an absent record. And it completes more easily across the three following statuses.

Who contributes, when, to what

A reference isn’t the property of a single role. Each status involves different contributors, and not making that explicit leads to the classic vicious circle — “that’s not my job, marketing will do it.”

At status 1 (signature): the rep enters the generic fields right after the close. Five fields, two minutes. Marketing creates the kickoff communication if there is one.

At status 2 (in progress): the project lead — or the senior consultant — captures the factual elements as they go. Not a writing chore, just short notes added to the record: “tech X chosen because Y,” “first rollout on the pilot agency, adoption at 67%.” Marketing can start preparing the ground for post-delivery content.

At status 3 (delivery): the rep or project lead fills in the descriptive fields. Marketing approves, requests client consent, produces the derived content (case study, web page, LinkedIn post). The library owner closes the initial cycle.

At status 4 (ongoing value): the rep or account owner updates when an event justifies it. Marketing relaunches content production if good news is confirmed — a renewal, an extension, an award the client received thanks to your work.

This distribution isn’t fixed. In a small firm, one or two people carry it all. In a larger firm, marketing and sales leadership share the upkeep. But making the roles explicit at each status is what separates a living library from an abandoned one.

Archiving: when to retire a reference from the library

The subject is rarely addressed, and yet it matters. Not every reference is meant to stay active forever. Three situations justify archiving.

The client has explicitly revoked their distribution consent. A request that must be honored immediately: pulling public content, making the record private, keeping it only for internal history.

The reference has become technologically obsolete. A legacy-system migration done in 2014 has no sales value in 2026 — the technical and regulatory conditions have changed. Keep it internally, remove it from proposal and public distribution.

The reference is about an activity you no longer sell. You pivoted, you dropped a service line. The matching projects no longer serve the current sales argument. Archive and possibly migrate to a “historical” status.

Archiving isn’t deletion. It’s a status change. The data stays, accessible for audit, internal history, analysis of what you’ve sold over five years. It just no longer surfaces in sales searches.


Key takeaways

  • Four statuses: initiated (signature), in progress, delivered, ongoing value — each produces its own content
  • The most common mistake: capturing only at status 3, so too late and with more difficulty
  • Capturing as you go takes 3 to 4 times less time than retroactive writing
  • Specifying the contributors at each status prevents the “that’s not my job”
  • Archiving is a status change, not a deletion

You have a model, templates, a lifecycle. At this stage, you have all the ingredients of a well-kept library — on paper. One practical obstacle remains: the entry burden. That’s the subject of chapter 5, which explains how AI lets you produce the material without constantly chasing the delivery teams.

Key takeaways
  • Four statuses: initiated, in progress, delivered, ongoing value.
  • Each status produces different content.
  • Who contributes when.
Chapter 05
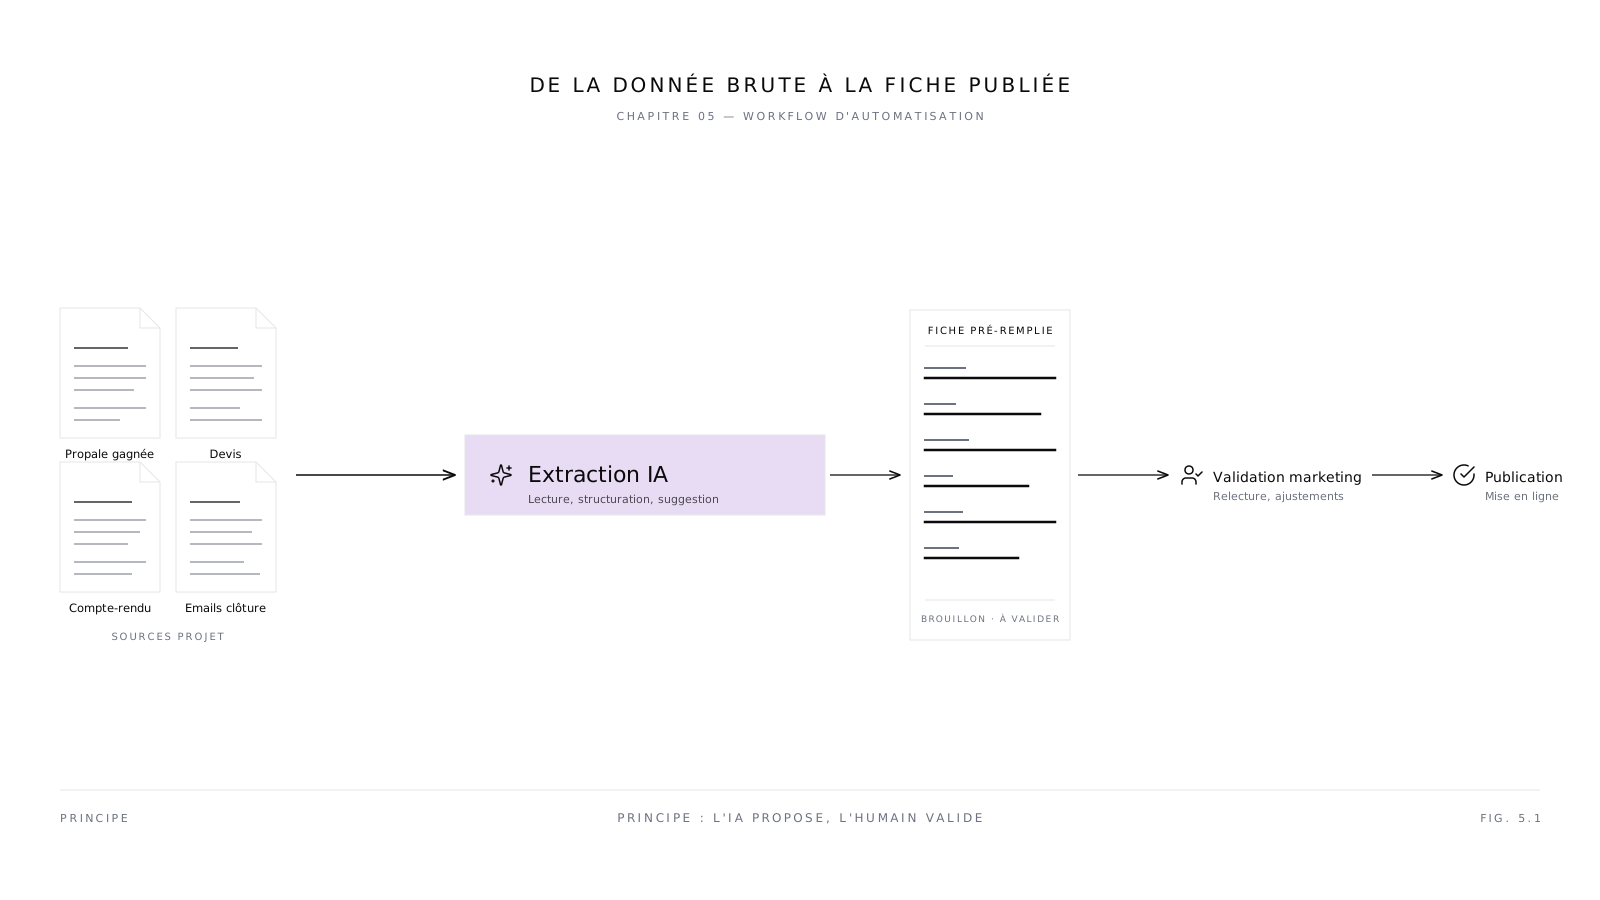
AI automation workflow: project documents (proposal, quote, report, emails) → AI extraction → pre-filled record → marketing approval → publication.

Chapter 5 — Automate with AI

The first four steps lay out the method. The fifth changes the economics of the subject. AI lets you produce the material without constantly chasing the delivery teams — provided you keep marketing in control.

All the previous chapters describe a method that works without AI — and yet, in practice, the firms that succeed in applying it are rare. The reason is always the same: the entry burden. A marketing team can produce a perfect model, impeccable templates, and a clear lifecycle; if it has to manually chase twenty project leads a month to get them to fill in their records, the library ends up a graveyard.

This is precisely the bottleneck AI can break. Not by replacing marketing — on the contrary, by handing it back control. This chapter details how, on what conditions, and which limits to keep in mind.

The real problem AI solves: the entry burden

Before talking about technical capabilities, you have to name the problem you’re trying to solve. It isn’t writing quality. It isn’t automating editorial decisions. It’s the initial entry burden.

In a professional services firm that delivers twenty projects a year, twenty reference records have to be created each year. Done by hand, each takes between one and three hours of work — rereading the report, finding the figures, phrasing the context, structuring the response. That’s twenty to sixty hours of annual work, spread across fifteen to twenty different people, none of whom has reference creation among their priorities.

It’s that precise moment — the first writing of a record — that saturates the delivery teams and sinks libraries. All the methods in the world don’t hold if that burden isn’t absorbed. AI solves this mechanically: the material already exists in the project documents, AI extracts it and proposes a pre-filled record. The project lead reviews it in five minutes instead of writing for two hours.

Put differently: AI doesn’t create knowledge, it restructures it. The knowledge is already in the reports, the won proposals, the closing emails, the quotes. It’s just not in the right format. AI does the formatting work. The project owner approves what’s right, corrects what isn’t, completes what’s missing.

Where AI draws the material from

Every professional services firm already produces the material for a reference record — they just don’t know it, because the material is scattered across several documents that were never meant to serve this need.

The won proposal contains the client context, the value promise, the proposed methodology. It’s the richest source for the descriptive fields (context, response delivered).

The quote or order carries the structured data: amount, scope, duration, dates, assigned team. It’s the source for the generic and quantified fields.

The closing report or end-of-project review contains the KPIs achieved, the difficulties resolved, the lessons learned. It’s the source for the quantified results and the implicit quote.

The project lead’s emails to the client document the project’s shifts, the trade-offs, the positive signals. Sources of precision and nuance.

The final deliverables (debrief decks, internal white papers, presentations to the client’s executive committee) are often the best sources of quotes and validated figures.

These sources already exist in all your systems — CRM, project drive, ERP, office suite. AI’s job is to read them, extract what matches each field of the model, and propose a pre-filled record. The record is never published automatically — it’s the owner or the library owner who approves.

AI drafts, you approve. Not the other way around

This is the non-negotiable principle. If you invert it, you lose your grip on the quality of your library.

AI can pre-fill a record in seconds from project documents. It can do so with high accuracy for structured fields (dates, amounts, cited technologies), and with more uncertain accuracy for descriptive fields (how the context is phrased, the choice of quote, the hierarchy of KPIs to feature). It’s precisely that uncertainty that justifies a human approving.

Approval doesn’t require writing — it requires checking, correcting, completing. It’s five to ten minutes of work for a record, where the initial writing took two hours. The ratio is such that adoption becomes possible: a project lead can spend ten minutes per project approving the record AI produced, where they refused two hours to write it.

Three practices make this approval efficient.

AI distinguishes what it’s sure of from what it isn’t. A well-built record shows a confidence score per field. The owner knows where to focus their review — on the three or four fields flagged as uncertain, not on the eight others that are reliable.

Marketing approves sensitive records before publication. Anything touching the client quote, public distribution, or the phrasing of the context goes through a marketing review before switching to “externally publishable.” AI speeds up the production of raw material. It doesn’t replace editorial decision-making.

The record owner stays identified and accountable. AI proposes, the owner approves, and they’re the one cited as contributor. This traceability prevents the drift of “no one reviewed it, the AI did it all on its own.”

Three levels of automation

Not every firm has the same need for automation. Three levels can be distinguished, by degree of investment and maturity.

Level 1 — Simple extraction. AI reads a document (the won proposal, the closing report) and extracts the structured elements: client name, industry, technologies, duration, amounts. The pre-filled record contains these structured fields; the owner fills in the descriptive fields by hand. Gain: 30 to 50% of entry time per record. Setup effort: low.

Level 2 — Complete pre-filled record. AI reads several documents (proposal, quote, report, deliverables) and produces a complete record, with structured and descriptive fields, and proposes a quote drawn from the documents when one is identifiable. The owner reviews and corrects. Gain: 60 to 80% of entry time per record. Setup effort: medium — you have to connect the document sources.

Level 3 — Continuous updating. AI monitors new entries in your systems (a contract signature in the CRM, a project closing in the ERP, the delivery of a final presentation) and automatically triggers the creation or evolution of a record at the appropriate status. The owner gets an approval notification at each step. Gain: the library builds in the background, with no manual chasing. Setup effort: high — you have to connect, configure, govern.

Starting at level 1 is often enough to transform the dynamic. Level 3 is a medium-term goal — it becomes relevant once the library has proven itself and internal maturity justifies it.

Security and confidentiality

AI applied to client data raises two technical questions that must be settled before any deployment.

No third-party model training on your data. This is the pivot. The contents of your won proposals, your reports, your closing emails, your client quotes are confidential by default. No serious reference-management tool feeds a public model with this data. Professional practice is to use models whose vendor contractually guarantees no training (zero-retention, no-training clauses), or to host inference in an isolated environment.

European hosting and GDPR compliance. The processed data contains personal information (names of client contacts, signatures, sometimes phone numbers). Processing must comply with the GDPR: European hosting, an up-to-date processing register, guaranteed individual rights. This requirement immediately rules out solutions that only offer US data centers or models whose inference chain isn’t auditable.

These two conditions aren’t marketing nuances. They’re prerequisites. A professional services firm that automates without guaranteeing them exposes itself to legal and reputational risks out of all proportion to the productivity gain it’s after.

Why AI doesn’t replace the library owner

There’s still a trap to avoid: believing that automation removes the need for an identified owner. It’s the opposite.

Without AI, the need for an owner is imposed by the entry burden — you need someone to chase, maintain, correct. With AI, that work largely disappears. But other responsibilities emerge: validating the extraction settings, arbitrating the cases where AI hesitates, adjusting the model when systematically empty fields reveal a missing source, governing the confidentiality of the pre-filled data.

These new responsibilities are fewer than the old ones, and more interesting. But they still assume an identified owner. An automated reference library with no governance drifts faster than a manual one — because AI produces content faster than anyone can approve it, and the absence of approval accumulates silent errors.

The rule doesn’t change: no identified owner, no library — automated or not.


Key takeaways

  • AI solves the initial entry-burden bottleneck, not the editorial decision
  • The material already exists in your documents (proposals, quotes, reports, deliverables) — AI restructures, it doesn’t invent
  • Non-negotiable principle: AI drafts, you approve. Always in that order
  • Three levels of automation are possible; starting with the simplest is often enough
  • Two technical prerequisites: no third-party model training, European GDPR hosting
  • AI doesn’t replace the library owner — it shifts their role toward governance

You have a library that’s modeled, templated, alive, and now fillable without an unreasonable entry burden. One last step remains: making what the library contains actually reach the right recipients, at the right moment, in the right format. That’s the subject of chapter 6 — smart distribution.

Key takeaways
  • The problem AI really solves: the entry burden.
  • AI drafts, you approve. Not the other way around.
  • Security and confidentiality: data in Europe, no third-party model training.
Chapter 06
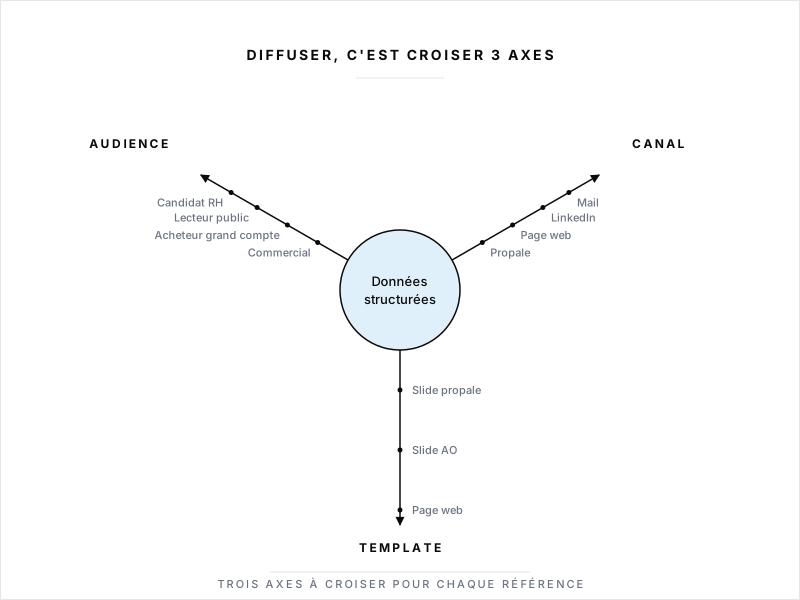
Distribution matrix: structured data at the center; three output axes — audience, channel, template.

Chapter 6 — Distribute intelligently

A well-filled library is useless if it doesn’t reach the right recipient at the right moment. Smart distribution is what turns a record into revenue.

Many firms stop one step too soon. They model, they tool up, they automate — and they publish. One case study a month on the blog, a LinkedIn post when marketing remembers, an “Our references” page lining up logos. The library exists; it doesn’t convert.

The missing link is selective distribution. That is: choosing, for each reference, who should see it, through which channel, in which format, at which moment. This chapter describes the three-axis matrix that structures that decision, the metrics that let you measure what actually serves, and the classic “publish everything” trap that dilutes impact.

Three axes to frame distribution

Distributing a reference doesn’t mean publishing it. It means choosing three variables that, crossed, determine how that reference will exist on the outside.

The audience. Who should see this reference? A rep preparing a proposal in retail? A buyer at a large group assessing your legitimacy? A public reader on LinkedIn discovering your expertise? An HR candidate trying to understand what you actually do? Each audience has a different expectation of the same data.

The channel. Where does the information travel? A proposal sent by email, a public vendor-listing page, an organic LinkedIn post, a slide in a meeting presentation, an RFP response document, a follow-up email after a first contact. Each channel has its own constraints of format, length, and confidentiality level.

The template. In what form? Proposal slide, long web page, LinkedIn thumbnail, line in an Excel matrix, paragraph in an email, downloadable PDF sheet. The template translates the raw data into the format the channel and audience expect.

Smart distribution consciously combines these three axes. A reference isn’t “published” or “not published”: it’s distributed according to precise combinations. The same project can be active in a retail proposal (sales audience + proposal channel + slide template), active in a large-group vendor listing (buyer audience + RFP channel + matrix template), absent from the public blog (because client consent isn’t obtained for the public channel).

It’s this granularity that separates a smartly distributed library from one published all at once. And it’s what requires having done the earlier chapters well: without a clear model and distribution statuses, this level of precision is impractical.

One datum, many formats — no re-entry

The operational benefit of this approach is measured at one precise point: you never re-enter. The same source record produces the proposal slide, the vendor-listing line, the LinkedIn post, and the web page — without any human recopying the information from one format to another.

This is what makes smart distribution economically viable. If every audience/channel/template combination requires manual production work, you naturally default to the cheapest format to produce — usually the proposal slide, because it already exists. The other formats stay on the backlog.

When production automates from the same source, the calculus changes. Producing a web page from an already-filled record becomes a question of templating, not writing. Same for the vendor matrix. Same for the LinkedIn post. You no longer choose the format by production cost — you choose by relevance to the audience.

This mechanic has another, more structural benefit: message consistency. When the vendor matrix, the proposal slide, and the web page all start from the same record, they tell the same story. The prospect who sees your reference across several successive channels sees an aligned message, not three diverging versions. It’s this consistency that builds trust over time.

Measuring what actually serves

Smart distribution is measurable. Without measurement, you distribute blind and learn nothing about what works. Three simple metrics are enough to steer.

The top references used. Which records go out most often in proposals, vendor listings, publications? This data is collected automatically once deliverable generation runs through your reference-management tool. After six months, you know which ten or twenty references carry most of the message — and which seventy never serve.

The usage rate per reference. Of all publishable references, what share is actually used at least once a quarter? A rate below 30% indicates either that the references aren’t relevant to real uses (a modeling problem) or that reps can’t find them (a search-ergonomics problem). Both are fixable — but you have to know.

Orphan references. Which records have never been used since creation? Three typical cases: the record is poorly filled (missing fields, wrong data), the record concerns an industry you no longer target, the record is technically obsolete. The treatment varies by case — enrichment, archiving, or deletion — but no treatment is the worst option.

These metrics don’t require complicated analysis. They come out of a simple dashboard, read by the library owner once a month, shared with the executive committee once a quarter. This ritual turns the library into a steering subject — not an administrative chore.

The “publish everything” trap

The most widely shared instinct when you have a well-filled library is to put it all online. Open the “Our references” page and line up the hundred records you own. The apparent logic: the more you show, the more you prove. The real logic: the more you show, the less each one counts.

Three reasons exhaustive distribution is less effective than selective distribution.

Inverted signal effect. A page showing a hundred references drowns the best ones in the mass. The prospect who scrolls sees logo, logo, logo — they read no record in detail. Conversely, a page presenting fifteen carefully chosen references, with figures, quotes, and legible contexts, demands active reading and conveys an impression of quality rather than volume.

Unowned maintenance burden. A hundred published records means a hundred records to keep up to date. When one goes stale, it stays online because no one individually steers the hundred. At two years, your reference page is a museum. Selective distribution limits this burden to a monitored subset.

SEO dilution. On the search-ranking side, a page that talks about everything ranks for nothing. Fifteen strong industry pages (a “banking/insurance references” page, a “retail references” page, an “industry references” page) perform better than a single page that aggregates everything.

Smart distribution is selective by construction. It relies on the measured top references used to decide what to feature, and keeps the rest accessible to reps internally without publishing it externally. It’s not a loss — it’s an editorial choice.

Selective distribution beats exhaustive distribution

To close this six-step method, two observations.

The first is commercial. The professional services firms that convert best on their references aren’t the ones with the most. They’re the ones with fifteen to thirty, perfectly up to date, segmented by industry, and accessible to reps in under ten seconds. Quantity is a signal of longevity; quality and accessibility are signals of reliability — and the decision is made on reliability.

The second is cultural. A well-distributed reference library changes the internal conversation. Marketing stops chasing reps (“do you have a reference in this industry?”) because the rep finds what they need alone, in seconds. The rep stops cobbling together slides at 11pm the night before a proposal, because the slide already exists. The executive committee stops asking for improvised reports on “what we actually sell,” because the data is there, structured, queryable. This collective de-saturation is the method’s real benefit — less visible than a conversion gain, more durable over time.

A well-kept reference library isn’t a tool. It’s an infrastructure. It takes six to twelve months to build properly, it serves for five to ten years, and it changes the firm’s commercial relationship to the knowledge it produces. It’s that investment this white paper aims to illuminate — not to push.


Key takeaways

  • Three axes structure distribution: audience, channel, template — to be crossed consciously for each reference
  • The same source record produces every format, with no re-entry — that’s what makes selective distribution viable
  • Three metrics to track: top references used, usage rate per reference, orphan references
  • Exhaustive distribution dilutes the signal and adds maintenance — selective distribution builds reliability
  • A well-kept library isn’t a tool, it’s an infrastructure — a 6-12 month investment, value over 5-10 years

You’ve gone through the complete method. The six steps can be applied independently, but they produce their full effect when sequenced in the right order: use, model, templates, lifecycle, automation, distribution. The summary on the next page recaps the whole, and the last page shows how to go further with Showy if putting it into practice interests you.

Key takeaways
  • Three axes: audience, channel, template.
  • Measuring what actually serves.
  • The 'publish everything' trap.
Summary

The method on one page.

Six steps, two principles: start from the uses, and accept not covering everything at first.

01

Define your use cases.

Before modeling, creating templates, or tooling up, you need to know what your references are for. This step determines everything that follows.

02

Model your references.

What is a reference at your firm? This modeling exercise is short, but it's what makes search, automatic generation, and steering possible.

03

Create your templates.

The template is where your data model meets your sales brand. Three templates are enough to cover most needs.

04

Think in lifecycle.

A reference isn't fixed. It has a four-status lifecycle. Thinking about that cycle from the start changes the dynamic of your library.

05

Automate with AI.

The first four steps lay out the method. The fifth changes the economics of the subject. AI lets you produce the material without constantly chasing the delivery teams — provided you keep marketing in control.

06

Distribute intelligently.

A well-filled library is useless if it doesn't reach the right recipient at the right moment. Smart distribution is what turns a record into revenue.

You've finished the white paper.

What's next is 30 minutes with a Showy expert.