Many firms stop one step too soon. They model, they tool up, they automate — and they publish. One case study a month on the blog, a LinkedIn post when marketing remembers, a “Our references” page lining up logos. The library exists; it doesn’t convert.
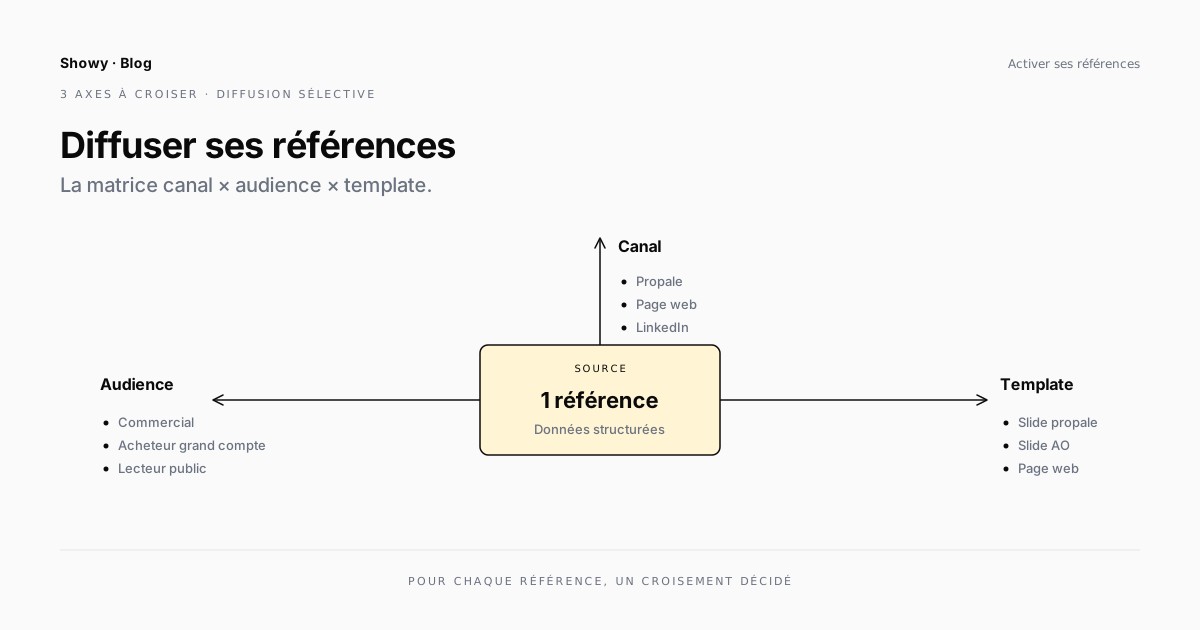
The missing link is selective distribution. That is: choosing, for each reference, who should see it, through which channel, in which format, at which moment. This article describes the three-axis matrix that structures that decision, the metrics that let you measure what actually serves, and the classic “publish everything” trap that dilutes impact.
Why distribution isn’t publication
Distributing a reference doesn’t mean making it public. It means choosing how, to whom, and through which channel that reference will exist outside your firm. That nuance changes everything.
Publication is a default act: you put it online and hope the right people see it. Distribution is a targeted act: you decide in advance, for each reference, which intersections of audience, channel, and format it will feed.
A reference can be:
- Active in a retail proposal (sales audience, proposal channel, slide template) — but
- Absent from the public blog (because client consent isn’t obtained)
- Active in a large-group vendor listing (standardized-buyer audience, RFP channel, matrix template) — without
- Appearing on LinkedIn
These intersections aren’t equivalent. Each calls for its own decision. Wanting to activate them all at once drags each toward the lowest common denominator.
Three axes to frame distribution
Smart distribution consciously combines three variables. Each has its own constraints.
The audience. Who should see this reference? A rep preparing a proposal in retail? A buyer at a large group assessing your legitimacy? A public reader on LinkedIn discovering your expertise? An HR candidate trying to understand what you actually do? Each audience has a different expectation of the same data.
The channel. Where does the information travel? A proposal sent by email, a public vendor-listing page, an organic LinkedIn post, a slide in a meeting presentation, an RFP response document, a follow-up email after a first contact. Each channel has its own constraints of format, length, and confidentiality level.
The template. In what form? Proposal slide, long web page, LinkedIn thumbnail, line in an Excel matrix, paragraph in an email, downloadable PDF sheet. The template translates the raw data into the format the channel and audience expect.
Smart distribution consciously combines these three axes. The same project can be active in a retail proposal, active in a large-group vendor listing, absent from the public blog — depending on the relevant intersections and on the client consents obtained.
It’s this granularity that separates a smartly distributed library from one published all at once. It requires having done the earlier steps well: without a clear model and per-field distribution statuses, this level of precision is impractical.
One datum, many formats — without re-entry
The operational benefit of this approach is measured at one precise point: you never re-enter. The same source record produces the proposal slide, the vendor-listing line, the LinkedIn post, and the web page — without any human recopying the information from one format to another.
This is what makes smart distribution economically viable. If every audience × channel × template combination requires manual production work, you naturally default to the cheapest format to produce — usually the proposal slide, because it already exists. The other formats stay on the backlog.
When production automates from the same source, the calculus changes. Producing a web page from an already-filled record becomes a question of templating, not writing. Same for the vendor matrix. Same for the LinkedIn post. You no longer choose the format by production cost — you choose by relevance to the audience.
This mechanic has a second, more structural benefit: message consistency. When the vendor matrix, the proposal slide, and the web page all start from the same record, they tell the same story. The prospect who sees your reference across several successive channels sees an aligned message, not three diverging versions. It’s this consistency that builds trust over time.
How to cross audience × channel × template in practice
The table below illustrates the matrix with a few concrete examples. The principle: for each active reference, you decide which intersections to activate. Not all are relevant for every reference.
| Audience | Channel | Template | Typical case |
|---|---|---|---|
| Sales rep | Proposal | Proposal slide | A retail reference to insert in a response |
| Large-account buyer | Standardized RFP | Excel matrix | Annual vendor listing for a public buyer |
| Public reader | Blog / web page | Long case study | SEO on a target industry |
| Social network | Organic LinkedIn | Post with visual | Featuring a recent client result |
| HR candidate | Company page | Summary sheet | Showing the diversity of projects |
| Standardized buyer | ”References” web page | Filterable list | Demonstrating portfolio depth |
For each reference, you activate the relevant intersections (per your sales strategy and the client consents obtained) and deactivate the others. A reference whose client hasn’t given public consent stays on the internal intersections (proposal, standardized RFP) — it never appears on public channels.
Measuring what actually serves
Smart distribution is measurable. Without measurement, you distribute blind and learn nothing about what works. Three simple metrics are enough to steer.
The top references used. Which records go out most often in proposals, vendor listings, publications? This data is collected automatically once deliverable generation runs through your reference-management tool. After six months, you know which ten or twenty references carry most of the sales message — and which sixty or seventy never serve.
The usage rate per reference. Of all publishable references, what share is actually used at least once a quarter? A rate below 30% indicates either that the references aren’t relevant to real uses (a modeling problem) or that reps can’t find them (a search-ergonomics problem). Both are fixable — but you have to know.
Orphan references. Which records have never been used since creation? Three typical cases: the record is poorly filled (missing fields, wrong data), the record concerns an industry you no longer target, the record is technologically obsolete. The treatment varies by case — enrichment, archiving, or deletion — but no treatment is the worst option.
These metrics don’t require complicated analysis. They come out of a simple dashboard, read by the library owner once a month, shared with the executive committee once a quarter. This ritual turns the library into a steering subject — not an administrative chore.
The “publish everything” trap
The most widely shared instinct when you have a well-filled library is to put it all online. Open the “Our references” page and line up the hundred records you own. The apparent logic: the more you show, the more you prove. The real logic: the more you show, the less each one counts.
Three reasons selective distribution beats exhaustive distribution.
Inverted signal effect. A page showing a hundred references drowns the best ones in the mass. The prospect who scrolls sees logo, logo, logo — they read no record in detail. Conversely, a page presenting fifteen carefully chosen references, with figures, quotes, and legible contexts, demands active reading and conveys an impression of quality rather than volume.
Unowned maintenance burden. A hundred published records means a hundred records to keep up to date. When one goes stale, it stays online because no one individually steers the hundred. At two years, your reference page is a museum. Selective distribution limits this burden to a monitored subset.
SEO dilution. On the search-ranking side, a page that talks about everything ranks for nothing. Fifteen strong industry pages (a “banking/insurance references” page, a “retail references” page, an “industry references” page) perform better than a single page that aggregates everything in disorder.
Smart distribution is selective by construction. It relies on the measured top references used to decide what to feature, and keeps the rest accessible to reps internally without publishing it externally. It’s not a loss — it’s an editorial choice.
Selective distribution beats exhaustive distribution
To sum up the article’s central observation: the professional services firms that convert best on their references aren’t the ones with the most. They’re the ones with fifteen to thirty, perfectly up to date, segmented by industry, and accessible in under ten seconds.
Quantity is a signal of longevity; quality and accessibility are signals of reliability — and in services, the purchasing decision is made on reliability.
A well-distributed reference library also changes the internal conversation. Marketing stops chasing reps (“do you have a reference in this industry?”) because the rep finds what they need alone, in seconds. The rep stops cobbling together slides at 11pm the night before a proposal. The executive committee stops asking for improvised reports on “what we actually sell.” This collective de-saturation is the method’s real benefit — less visible than a conversion gain, more durable over time.
→ For the full method — from modeling to smart distribution, by way of AI automation — download the Showy white paper. Six steps you can apply separately, designed to reinforce each other.
FAQ
How many references should you publish on your website?
Between fifteen and thirty, segmented by industry or type of engagement. Beyond that, you dilute the signal with no benefit. Under fifteen, you give the impression of a young firm. Professional services firms between 50 and 500 people generally converge on twenty to twenty-five actively maintained public references.
Should you publish different versions of the same reference on different channels?
Ideally yes, but without re-entry. The same source record generates the LinkedIn post (a 200-character summary), the proposal slide (an impactful 6-second-read visual), the web page (an 800-word case study). If each version requires manual writing, you naturally default to the cheapest and the others stay on the backlog.
What do you do with “orphan” references that are never used?
A three-minute diagnosis: is the record well filled? Does the industry match what you sell today? Has the technology become obsolete? Depending on the diagnosis, you enrich the record, archive it, or delete it. No treatment is the only option to avoid.
How often should you revisit the distribution strategy?
Once a quarter is enough. Read the top references used, identify new references to feature, archive orphan references. A short thirty-minute ritual internally. No need for more.
Does LinkedIn distribution actually work for B2B references?
Yes, but only if you don’t treat it as an exhaustive publication channel. A monthly post targeted on a recent client reference, with a striking figure and a tactical lesson, generates more engagement and leads than a weekly post that dilutes. The “less, but better” rule applies particularly to LinkedIn.